Psychological effects by topic
Neuromarketing effect library Beta
Beta: The neuromarketing effect library is still being built. New effects are added all the time, and I am still checking some sources.
If you spot a mistake or have a comment, please write to christian@christiandietz.net

Psychological effects by topic
What brain research shows
 FREDEFFECT#001Price as a quality signal (placebo effect in marketing)You taste the pricePlassmann et al. (2008) · Proceedings of the National Academy of Sciences

Can a price tag change the taste? A research team around Plassmann, O’Doherty, Shiv and Rangel tested this with wine in 2008.
20 volunteers lay in a brain scanner and tasted wine. For each wine, the researchers named a price. The same wine appeared twice: once as a $5 wine, once as a $45 wine. A second wine ran once as a $90 wine and once as a $10 wine.
The supposedly expensive wine tasted better. The brain showed it too: a region in the frontal lobe that is linked to experienced pleasure was more active. Experts call it the medial orbitofrontal cortex.
So the price changes more than the opinion of a product. It changes the experience itself.
Source
- Plassmann, H., O’Doherty, J., Shiv, B. & Rangel, A. (2008). Marketing actions can modulate neural representations of experienced pleasantness. Proceedings of the National Academy of Sciences, 105(3), 1050–1054.
Limitation: 20 people, wine tasting in a brain scanner.
Choice, patience and memory
 FREDEFFECT#005Choice overloadThe jam shelfIyengar & Lepper (2000) · Journal of Personality and Social Psychology

A tasting stand in a Californian delicatessen. Sometimes there were 6 kinds of jam, sometimes 24. In 2000, Iyengar and Lepper wanted to know: does more choice sell more? Everyone who came to the stand got a coupon for $1 off.
The large choice attracted more people. With 24 kinds, 60 of 100 passers-by stopped, with 6 kinds 40 of 100. On average they tasted only one or two kinds, however large the choice was.
When it came to buying, the picture flipped. Of those who had stopped at the small stand, 30 of 100 bought a jar. At the large stand it was 3 of 100.
A second experiment from the same study, with Godiva chocolates, delivers more reliable numbers. Students at Columbia University picked one chocolate to taste from 6 or from 30 kinds. As a reward for taking part, they could then choose: $5 in cash or a box of chocolates of the same value. After the small choice, 16 of 33 took the chocolates, about every second person. After the large choice it was 4 of 34, about one in nine. Those who had chosen from a few kinds were also more satisfied with their choice.
Source
- Iyengar, S. S. & Lepper, M. R. (2000). When choice is demotivating: Can one desire too much of a good thing? Journal of Personality and Social Psychology, 79(6), 995–1006.
Limitation: The jam experiment is a single field experiment in one shop. A meta-analysis by Chernev and colleagues (2015) shows that the effect depends strongly on the circumstances.
Defaults, ownership and loss
 FREDEFFECT#013Loss aversionThe fear of lossKahneman & Tversky (1979) · Econometrica

A coin is tossed. Heads, you win €100. Tails, you lose €100. Mathematically, the game ends up at plus minus zero. Most people still say no.
In 1979, the psychologists Daniel Kahneman and Amos Tversky added this pattern to their theory of how people decide under uncertainty. Kahneman received the Nobel Prize in Economics for it in 2002.
One core claim of the theory: losses weigh more heavily than gains of the same size. Kahneman puts the ratio at 1.5 to 2.5. So a loss hurts one and a half to two and a half times as much as an equal gain feels good.
In marketing, this explains why free trial periods work. What you already have, you hate to give back. Cancelling feels like a loss.
Source
- Kahneman, D. & Tversky, A. (1979). Prospect theory: An analysis of decision under risk. Econometrica, 47(2), 263–291.
Limitation: How much more losses weigh than gains is disputed. More recent work sees the effect as depending on the situation.
Prices and numbers
 FREDEFFECT#020Anchoring effectThe anchorTversky & Kahneman (1974) · Science; Kahneman (2012) · Thinking, Fast and Slow

What percentage of the member states of the United Nations are in Africa? Participants in an experiment reported by Amos Tversky and Daniel Kahneman in 1974 had to estimate it.
Beforehand, the researchers spun a wheel of fortune with the numbers 0 to 100 in front of them. As Kahneman later tells in his book “Thinking, Fast and Slow”, it was secretly rigged to stop only at 10 or at 65, and the participants were students at the University of Oregon. They first had to say whether the share in question was higher or lower than the number on the wheel. Then they gave their own estimate.
Those who had seen the 10 estimated 25 per cent. Those who had seen the 65 estimated 45 per cent. In each case, this is the middle value when all estimates are put in order by size. The number on the wheel was obviously random. Still, it pulled the estimates in its direction.
How strong the pull was, Kahneman puts at 44 per cent in his book. That means almost half of the distance between the two wheel numbers showed up in the estimates. At 100 per cent, people would simply have adopted the wheel number; at 0 per cent, they would have ignored it. Using the figures from the 1974 paper, you get a little over a third: the wheel numbers were 55 points apart, the estimates 20 points.
Experts call this first number an anchor. In retail, the crossed-out price lives off it: if the offer of €129 sits next to an old price of €199, you measure the offer against the 199.
Sources
- FREDEFFECT#020a · Tversky, A. & Kahneman, D. (1974). Judgment under uncertainty: Heuristics and biases. Science, 185(4157), 1124–1131.
- FREDEFFECT#020b · Kahneman, D. (2012). Schnelles Denken, langsames Denken. Siedler. Kapitel 11 (Original: Thinking, Fast and Slow, 2011).
Sources: The estimates of 25 and 45 per cent are in the paper (a). The rigged wheel, the Oregon students and the 44 per cent come from Kahneman's book (b). Where the difference between 44 per cent and a little over a third comes from, the book does not explain.
Repetition, fluency and priming
 FREDEFFECT#030Illusory truth effectRepetitionHasher et al. (1977) · Journal of Verbal Learning and Verbal Behavior

The more often you hear something, the more likely you are to believe it. Hasher, Goldstein and Toppino showed this in an experiment in 1977.
40 students listened to a tape of 60 statements on politics, sport and art, plausible but little known. Some were true, some were not. They then rated each statement for how true it seemed, on a scale from 1 (“definitely false”) to 7 (“definitely true”). They came three times, two weeks apart. 20 statements came back every time, the rest were new.
The repeated statements got higher truth ratings each time, on average from 4.4 to 4.7. The new ones stayed at around 4.2. Whether a statement was true played no part. False statements, too, seemed more credible after being repeated.
The explanation lies in memory, which works along unnoticed: what sounds familiar feels right. That helps advertising slogans just as much as rumours.
Source
- Hasher, L., Goldstein, D. & Toppino, T. (1977). Frequency and the conference of referential validity. Journal of Verbal Learning and Verbal Behavior, 16(1), 107–112.
Limitation: 40 people. The rise is small, but it affected true and false statements alike.
Images, gaze and attention
 FREDEFFECT#039Picture superiority effect2,560 photosStanding et al. (1970) · Psychonomic Science

How many pictures can a person remember? Standing, Conezio and Haber put this to the test in 1970.
Their participants saw 2,560 photos, each for ten seconds, spread over two to four days. Then the researchers showed them 280 pairs of pictures, each with one photo they had seen and one new one.
In 85 to 95 cases out of 100 they picked the right one, around 90 on average. After a single look.
For communication, that is good news. Pictures stick in the memory, quickly and in large numbers.
Source
- Standing, L., Conezio, J. & Haber, R. N. (1970). Perception and memory for pictures: Single-trial learning of 2500 visual stimuli. Psychonomic Science, 19(2), 73–74.
Limitation: Only 5 people. Recognising is easier than free recall.
Curiosity and unfinished business
 FREDEFFECT#047Zeigarnik effectThe waiter effectZeigarnik (1927) · Psychologische Forschung

Why does an unfinished task keep nagging at us? The psychologist Bluma Zeigarnik investigated this in Berlin in 1927.
Her participants were given a series of small tasks. They finished some, and were interrupted during others.
They remembered the interrupted tasks almost twice as well as the finished ones. Zeigarnik herself writes: 90 per cent better.
The explanation: what is left open creates an unpleasant tension and keeps the mind busy until it is completed. In marketing, progress bars are one use of this, or small cliffhangers between two steps of a buying process.
Source
- Zeigarnik, B. (1927). Das Behalten erledigter und unerledigter Handlungen. In K. Lewin (Hrsg.), Untersuchungen zur Handlungs- und Affektpsychologie III. Psychologische Forschung, 9, 1–85.
Limitation: The key figure comes from a series of experiments with 32 people. In 6 of them the effect did not show.
Other people as the yardstick
 FREDEFFECT#050Social proof (majority norm)The hotel towelsGoldstein et al. (2008) · Journal of Consumer Research

How do you get hotel guests to use their towel more than once? Noah Goldstein, Robert Cialdini and Vladas Griskevicius studied in 2008 how social norms can help protect the environment in hotels. Social norms are unwritten rules about what others do or approve of.
Their approach: instead of appealing to environmental awareness, you tell guests what most other guests do.
With the usual sign asking for environmental protection, the towel was used again in 35 out of 100 cases. When the sign said that most guests use their towel more than once, it was 44 out of 100, about a quarter more. In a second trial, the note about the guests who had stayed in the same room before worked best: 49 out of 100.
A 2022 meta-analysis by Melnyk and colleagues, covering 101 studies, confirms that looking at others works. Hints about what others do work better than hints about what others approve of.
Experts call this social proof. If you are unsure, you follow the majority.
Source
- Goldstein, N. J., Cialdini, R. B. & Griskevicius, V. (2008). A room with a viewpoint: Using social norms to motivate environmental conservation in hotels. Journal of Consumer Research, 35(3), 472–482.
Limitation: One hotel. What was counted was opportunities to reuse a towel, not individual guests.
Stories, language and sound
 FREDEFFECT#060Identifiable victim effectRokia versus the statisticSmall et al. (2007) · Organizational Behavior and Human Decision Processes

Does a single child move people more than a statistic? Small, Loewenstein and Slovic tested this with donations in 2007.
159 participants received $5 in one-dollar bills for filling in a short questionnaire. Then they read either the story of seven-year-old Rokia from Mali or a statistic about hunger. After that, they could donate some of their money.
For Rokia they gave $2.38 on average. For the statistic only $1.14, less than half.
The third group was the surprise. It got Rokia’s story together with the statistic. Here only $1.43 came in. The numbers dampened the compassion that the story had awakened.
Source
- Small, D. A., Loewenstein, G. & Slovic, P. (2007). Sympathy and callousness: The impact of deliberative thought on donations to identifiable and statistical victims. Organizational Behavior and Human Decision Processes, 102(2), 143–153.
Limitation: A later replication, whose procedure and analysis had been publicly fixed in advance, did not find the effect.
Scarcity, pressure and doing it yourself
 FREDEFFECT#067ScarcityThe cookie jarWorchel et al. (1975) · Journal of Personality and Social Psychology

Does something become more valuable just because it is scarce? Stephen Worchel, Jerry Lee and Akanbi Adewole tested this with cookies in 1975.
Sometimes ten cookies sat in a jar, sometimes only two. The scarce cookies were rated higher, even though they were the same ones. They were most desirable when the jar was full at first and then became scarce because other participants needed cookies.
A 2022 meta-analysis by Barton and colleagues confirms that scarcity increases purchase intent. Whether supply is limited, time is short or demand is high makes only a small difference on average, and it is not statistically certain.
Source
- Worchel, S., Lee, J. & Adewole, A. (1975). Effects of supply and demand on ratings of object value. Journal of Personality and Social Psychology, 32(5), 906–914.
Limitation: Cookies in a lab, around 11 people per test group.
Network effect
 FREDEFFECT#070Network effect (Metcalfe’s law)Metcalfe’s law, put to the testZhang et al. (2015) · Journal of Computer Science and Technology
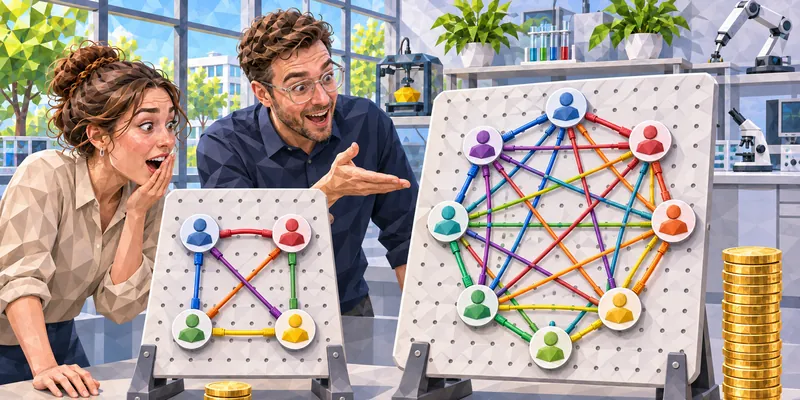
Metcalfe’s law says: the value of a network grows with the square of its number of users. Twice as many users means four times the value.
Zhang, Liu and Xu tested this with real data in 2015. They took the user numbers and revenues of Tencent (2003 to 2013) and Facebook (2004 to 2014) and tested four formulas that might describe the relationship.
The square of the user number fitted best, that is, Metcalfe’s law. For Tencent it came about ten times closer to the real figures than the next-best formula, for Facebook about twice as close. However, costs also grew with the square of the user number.
For platforms and communities this means growth pays off disproportionately. Every new user makes the network more valuable for everyone else.
Source
- Zhang, X.-Z., Liu, J.-J. & Xu, Z.-W. (2015). Tencent and Facebook data validate Metcalfe’s law. Journal of Computer Science and Technology, 30(2), 246–251.
Limitation: Only two companies.
Neuromarketing that helps
 FREDEFFECT#073Happy Meal effect (a bonus instead of more food)Half the portion, the same rewardReimann et al. (2016) · Journal of the Association for Consumer Research

Can half a portion make you as happy as a whole one? The marketing researchers Martin Reimann, Deborah MacInnis and Antoine Bechara investigated this in 2016, inspired by the toy in a children’s meal.
In a brain scanner, participants saw different offers: a full portion, a half portion, and a half portion with a small extra that had nothing to do with food, such as the chance of winning money. The half portion with the extra activated the same reward region as the full portion. This region lies deep in the brain; experts call it the striatum.
It showed in behaviour too. Without the extra, 73 out of 100 participants chose the full portion. When the half portion came with the prospect of winning $10, only 35 out of 100 took the full one.
The mere possibility of a win attracted most, on the scratch-card principle. An uncertain extra worked better than a certain one.
Source
- Reimann, M., MacInnis, D. & Bechara, A. (2016). Can smaller meals make you happy? Behavioral, neurophysiological, and psychological insights into motivating smaller portion choice. Journal of the Association for Consumer Research, 1(1), 71–91.
Limitation: Lab setting. The experiment does not show whether it works the same way in a restaurant.
Planning an event?
Then tell me about it. If you have questions, you can reach me at anfrage@christiandietz.net.